
*** Hot Off the Press ***
Best U.S. Trading Assistance Portal: TradingSmarts
(Awarded by Wealth & Finance International, March 23, 2017)
Hi friend! This blog post – Best Technical Analysis: No. 1 Support and Resistance – deals with perhaps the two most talked about aspects of understanding how to interrupt price action. Seasoned traders know all about these levels – the basic building blocks of their highly profitable trading strategies.
By the time you finish reading this blog, you will join their ranks, and enjoy the same kind of success they do.
What you will learn here applies equally to all markets – not just the forex.
Forex technical analysis follows the same precepts as those used in other markets.
If you want to speed ahead, check out the Table of Contents now.
Forex Tip
Key U.S. economic data is released in the morning. This is when the forex market reacts, and attaches its value to the U.S. dollar.
Most U.S. data reports come out at 8:30 am ET, while others are released between 9 and 10 am ET.
Canadian data reports usually appear between 7 and 9 am ET.
There are also a few U.S. economic reports that variously hit the news at noon or 2 pm ET.
Daily trading operations for the London and European financial centers start to wind down around noon ET – more like ~11:30 am ET.
That is the time of the so-called ‘London or European close,’ which more often than not results in a swing in price action. Swing traders please take note.
For the other times to focus on, please consult the #3 strategy at this link:
https://www.tradingsmarts.com/forex-wealth/
There are six times of the day when you should strap in and watch closely for swing points. You will find them at that link.
I know of a trader who only trades the London close, which is ~8:30 am PT Seattle time (11:30 am ET).
Given that she lives on the West coast of the U.S., that allows her to get her trading out of the way in the morning (very profitably so, I might add), and enjoy her afternoons off to do other things.
No matter where you live on this wonderful planet of ours, you will find at least one of those six times that suits your lifestyle.
Table of Contents:
Forex Tip
Intro
S&R Overview
Support and Resistance Simplified
Support Level
Resistance Level
Support and Resistance Pix
1-2-3 Bottom
UCP Pattern
All In
Support vs Resistance
Stronger or Weaker S&R
Timeframe
Strength of S&R
Retracements & Trendlines
Breached or Tested
Follow-Through
This is a Test
How to Read Patterns
In Sum
Required Reading
Technical Analysis Tools
Technical Analysis Definition
Inspiration
References
Conclusion

Intro
There is no way I can cover technical analysis from A to Z in just one blog post, but I will do my best to do it justice.
Nor is it intended as a technical analysis tutorial or a support and resistance tutorial.
Its purpose is to focus primarily on support and resistance, and how to read/trade price action in relation to those levels.
However, it is applicable to traders with varying degrees of trading backgrounds.
With that in mind, let us begin…
S&R Overview
If you have ever taken a technical analysis course, you realize how important understanding the concepts of support and resistance is.
They refer to price levels on charts that have a tendency of preventing price continuing along the path it is on.
Instead, price tends to stop and reverse at these strategic levels, almost as if by magic.
Whether it be support or resistance, these levels are characterized by price touching them multiple times without price penetrating the level.
Support and Resistance Simplified:
A support level is a level where price seems to find a ‘floor,’ as it swoons. It can be seen to ‘bounce’ off this level, rather than breaking through it.
However, once price successfully breaches this level beyond some intervening price fluctuations, it will most likely continue to fall until it encounters another level of support.
A resistance level, on the other hand, is where price is seen to encounter a level of resistance in its ascent.
Accordingly, price will more than likely be repelled by this level, rather than breaching it.
When a breach does occur, again beyond some intervening price fluctuations, it is likely that price will continue to rise until encountering another level of resistance.
Some price levels tend to prevent price from continuing along a certain path.
Levels of resistance are sometimes referred to as as a ‘ceiling,’ in that such levels appear to stop price in its tracks, as it progresses upwards.
Conversely, levels of support tend to provide a ‘floor’ by preventing the price from progressing further down.
Being able to identify a support level will enable you to potentially spot a good buying opportunity, because this is where other market participants will also be seeing the same thing, fuelling upward price momentum (a place to jump into a long trade, and/or ‘take profits’ on a short trade).
On the flip side, when you are able to identify a resistance level, you will be better positioned to see this as potentially a good selling opportunity.
You will not be alone, because other players in the market will likewise be smelling a good trade to the short side, and/or a place to ‘take profits’ on a long trade.
Fully understanding these concepts will better prepare you to develop a support and resistance trading strategy that works for you.
Support and Resistance Pix

(Chart via https://www.prorealtime.com/en/)
1-2-3 Bottom
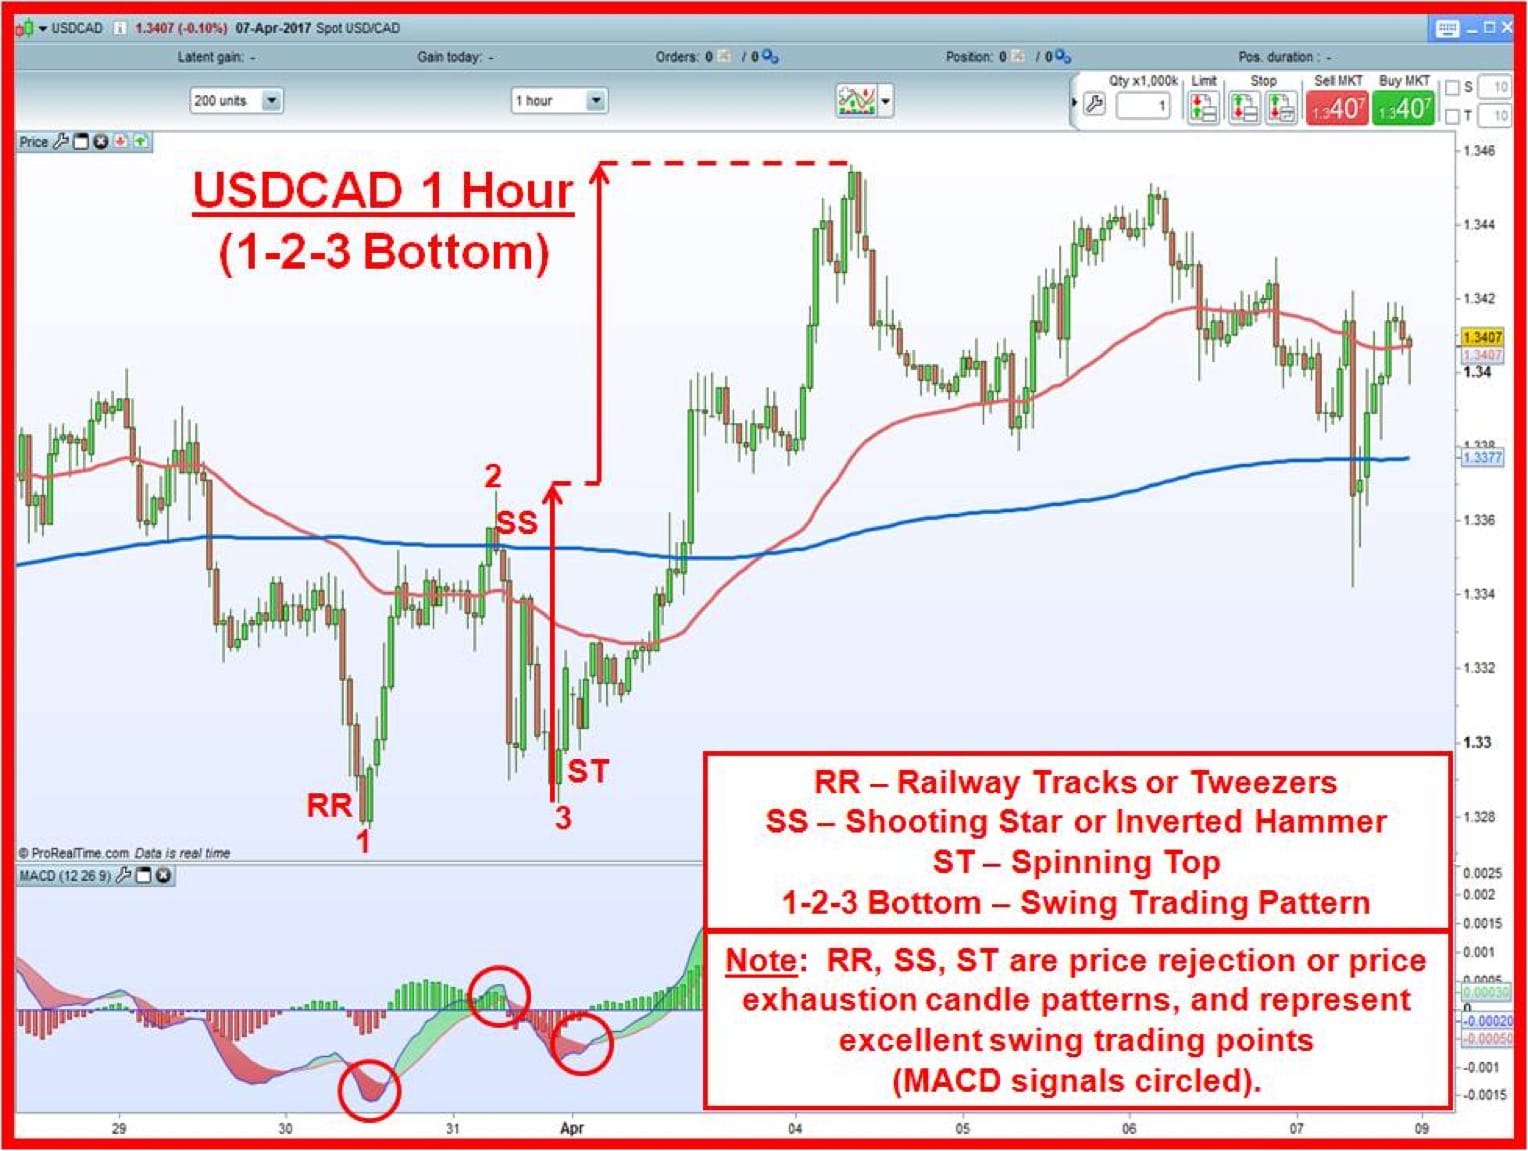
(Chart via https://www.prorealtime.com/en/)
UCP Pattern

(Chart via https://www.prorealtime.com/en/)
All In

(Chart via https://www.prorealtime.com/en/)
Please study the technical analysis charts above for a dose of technical analysis chart patterns.
Hopefully, by studying those technical analysis examples, you will gain an understanding of how to draw support and resistance lines, and have a better appreciation for those levels in the process.
Notice the lines I have drawn with dotted lines.
RR and SS are explained on the chart. They are two of the three candle patterns that I pay attention to. The other one is the spinning top (ST).
UCP perhaps needs some explanation. This is an Uptrend Continuation Pattern that consists of three phases – Leg 1, PEC, and Leg 2. Leg 2 is usually the same distance as Leg 1.
For you Fibo fans out there, the end of the PEC phase usually occurs in and around the 38.2% retracement level, and Leg 2 usually concludes in and around the 127% extension level.
You don’t have to know anything about Fibo (Fibonacci), but I just thought I’d throw that in.
At any rate, you would normally buy at the end of the PEC phase, when MACD usually punches up through its trigger line (not shown).
More on price patterns later on in this blog post.
One other thing worthy of mention regarding the above charts is the 1-2-3 bottom formation, which occurs at the end of a run down in price.
It is a classic reversal pattern. The number 3 point is typically higher than the number 1 point.
In terms of trading such a pattern, you can do it in either of two ways – by placing a buy stop atop the number 2 point, and letting the market take you into the trade, or by going in at market anywhere from the number 3 point to the number 2 point – although closer to the number 2 point is preferable (say half way up between those two points).
You can trade this pattern with confidence, knowing what price’s ultimate destination is – the distance from the number 3 point measured up to the number 2 point, and the result projected up from the number 2 point.
Notice how the three candle formations – RR, SS, and ST – played a role in defining the three turning points of the 1-2-3 bottoming formation.
At times, you will also see a 1-2-3 top, which is the exact opposite of a 1-2-3 bottom. It occurs at the end of a run up in price.
Support vs Resistance

Support is a level at which buying interest takes precedence over selling interest, causing price to bottom out, stop declining, or pause.
Support can be thought of as a ‘floor’ for price when it is swooning.
Resistance sees selling interest come into play, interrupting buying interest, thereby causing price to pause, peak, or stall in its ascent.
Resistance can be seen as a ‘ceiling’ when price is advancing.
Prior price action, such as key highs and lows, helps to determine support and resistance levels.
Areas of congestion or consolidation also play a part in determining these levels.
This is where price halts in its tracks, and can’t seem to pick a direction for a period of time – from minutes to hours.
Support and resistance can also be determined by drawing Tom DeMark trendlines, which is a subject all unto its own.
I’ll attempt to cover this topic to some degree later on in this blog post.
Still other forms of support and resistance come from technical analysis considerations like:
1-2-3 tops and bottoms,
50% retracements,
double tops and bottoms,
Elliott Waves,
exponential moving averages,
Fibonacci levels,
head and shoulders patterns,
pivot points,
price patterns, such as the UCP pattern I showed you in a chart above,
etc.
To see some of these aspects of technical analysis in play, please go to this blog post:
https://www.tradingsmarts.com/forex-wealth/
A word on what happens when a support or resistance level is breached successfully…
Once a support level is broken to the downside, that level then becomes a level of resistance, when price tries to regain its former momentum to the upside.
After a resistance level is broken to the upside, it reverses roles, and acts to support any further attempts by price to advance.
Stronger or Weaker S&R

The question becomes one of how to determine if a level of support or resistance is strong or weak – i.e. major or minor.
That’s where the significance of time and price come into play.
Timeframe:
The longer the timeframe of the price point, the greater its significance.
A weekly high/low trumps a daily high/low, which in turn trumps an hourly high/low, etc., down the line.
It all depends on which timeframe you are trading.
Some traders only trade off the 1 hour forex trading chart, so they pay particular attention to support and resistance levels on that chart.
That’s not to say they aren’t aware of support and resistance levels on the higher timeframes but, as you can see in the USDCAD 1 hour chart presented earlier, those support and resistance levels are very significant for such traders – more so than S&R levels on the higher timeframes.
They respect the levels on the 1 hour chart, and trade accordingly, without paying much regard to what they see on the higher timeframes.
That’s because they are trading a shorter timeframe – the 1 hour – which means that they will be in and out of a trade long before the support and resistance levels on the higher timeframes bear any true significance.
If, however, a trader wishes to hold a trade off the 1 hour chart for a longer period of time, then the support and resistance levels on the higher timeframes would become more meaningful.
Strength of S&R:
Durability and timeframe are factors in determining strength or weakness of a Tom DeMark trendline.
A Tom DeMark trendline on a daily chart carries more weight than one on the 1 hour chart.
But, like I said before, it all depends on which timeframe a trader is trading.
If it’s the 1 hour, then a Tom DeMark trendline at that level will be more influential, again unless the trader decides to hold the trade for a longer period of time – in which case a higher timeframe would be consulted.
A Tom DeMark trendline that has six months’ history has greater impact than one that’s more recent and just unfolding.
Also, the longer a Tom DeMark trendline holds, after being tested a number of times, the more viable it is.
By being tested, I mean price touching the trendline, but not breaking through, or only breaking through briefly, but not convincingly.
To see how a Tom DeMark trendline is constructed, please visit the link below, and check out strategy #7.
https://www.tradingsmarts.com/forex-wealth/
Retracements & Trendlines:
In the USDCAD 1 Hour chart below, you can see how price retraced ~50%, after the UCP pattern consummated, and found support at the support level that was formed during the PEC phase.
That level of support held, and price bounded off it, seeking higher ground.
The strength of that support level, as evidenced by price being repelled there, was due to it forming during a robust Uptrend Continuation Pattern, when price was consolidating between the two legs of the powerful up-move (lots of gas).

(Chart via https://www.prorealtime.com/en/)
You can see another example of a 50% retracement in the chart below:

(Chart via https://www.prorealtime.com/en/)
In the chart below (over to the right), the Tom Demark demand trendline, that acted as support in the move down in price, acted as resistance in any retracement attempts to move higher.
To the left in that same chart, you can see how the Tom DeMark resistance trendline was breached quite convincingly, as price powered up through it.
This was when the Uptrend Continuation Pattern (UCP) began to unfold, following the formation of the right shoulder of the inverted head and shoulders pattern.
Price measurement was achieved by measuring the distance from the lowest point below the trendline up to the trendline, and then projecting that distance up beyond it, starting at the point price broke through.
Similarly, over to the right in that same chart below, you can see how I performed the price measurement there. Just like magic.

(Chart via https://www.prorealtime.com/en/)
Breached or Tested:
As I stated above, a level of support or resistance, such as a Tom DeMark trendline, can be broken convincingly in a heart beat or challenged multiple times.
Throughout this blog post, I have focussed on the 1 hour chart.
Intra-day traders not only focus on that chart, but also the 5 and 15 minute charts.
They are similarly looking for tests of short-term support and resistance levels too, as well as the significance of their highs and lows on those charts.
Position traders tend to work off the higher-level charts, such as the daily, weekly, etc.
They work with longer-term levels of support and resistance, but the same principles of trading breaks apply.
Their interest lies mainly in the relevance of highs and lows on those higher timeframes.
All traders in the know perform some form of technical analysis, irrespective of which timeframe they are working with.
Follow-Through:
Follow-through refers to the attitude of price, after it breaks through a level of support or resistance – i.e. carrying on in the new direction – and the strength of the ensuing move.
Referring to the break of the Tom DeMark resistance trendline in the 1 hour chart above, once it was broken, price motored higher, as those traders who were short up to that point covered their positions, and new traders jumped on board en masse.
This is a Test:
Can you spot more patterns in the chart below? See the answers in the chart immediately following that one.
You will notice that, throughout this blog post, I have used the same 1 hour USDCAD chart.
By now, you should be amazed by how much you can glean off of just one chart (in this case the 1 hour) by having a working knowledge of chart patterns, support and resistance levels, retracements, trendlines, etc. – all important aspects of technical analysis.
Technical analysis using multiple timeframes can come into play when you are day trading, position trading, swing trading, or transitioning a trade say off the 1 hour trade to a longer timeframe.

(Chart via https://www.prorealtime.com/en/)

(Chart via https://www.prorealtime.com/en/)
How to Read Patterns:
As to how to read the four patterns presented in this blog post – DCP, DRP, UCP, and URP – and trade them accordingly, a brief comment or two in that regard is in order.
Again, here is what those abbreviations mean:
DCP – Downtrend Continuation Pattern
DRP – Downtrend Reversal Pattern
UCP – Uptrend Continuation Pattern
URP – Uptrend Reversal Pattern
These four patterns are component parts of technical analysis, and occur time and again on all charts – from the highest to the lowest – so be sure to be on the lookout for them, as they will give you a leg up in sleuthing price direction and determining to what extent price will travel.
Once you recognize one of these patterns unfolding, the time to take action is towards the end of the PEC phase (Price Equilibrium or Consolidation).
That would be the time to buy or sell, depending upon which pattern we are talking about – buying in the cases of DRP and UCP (presented earlier), and selling in the cases of DCP and URP.
From the point-of-view of profit potential, Leg 2 is usually the same distance as Leg 1, so an exit point would be targeted towards the end of Leg 2.
Traders want to know the direction price is assuming, how convincingly, the distance it will travel, and when it will shift gears, then heading in a new direction.
That’s the beauty of these four patterns, once you get good at recognizing them.
You know where price is going and how far, which just proves the point that price is the number one indicator.
Price leaves clues. It telegraphs where it is going.
You don’t need to look at anything else other than price to figure out where price is going next.
That said, you will notice in the chart above that I have noted the instances of MACD Histogram divergences to price and the one occurrence of MACD divergence to price.
Recognizing such divergence is helpful in getting a leg up on price’s next move.
For instance, in the case of the one occurrence of MACD divergence, you will notice that price was advancing in the form of Leg 2 of the DRP pattern, all the while MACD was remaining flat above the waterline – meaning that a shift in price to the downside was to be expected.
Study the instances of MACD histogram divergence to see if you can ascertain how they helped foretell a change in price direction.
In Sum
Hopefully by now you have a firm grasp of the technical analysis basics of support and resistance.
Study again the Support and Resistance Pix I presented earlier to see if can identify similar levels on your charts.
Practice makes perfect.
Eventually, it will become second nature for you to spot them on the fly.
Required Reading
One of the best technical analysis books, in my opinion, is Tom DeMark’s ‘New Science of Technical Analysis.’ He is the only person on this planet that I know of who is a master at drawing trendlines the right way.
Technical Analysis Tools
If you would like to get your hands on a good support and resistance MT4 indicator, please contact me. You can also request my favourite pivot point calculator at the same time.
If you would also like a pip value calculator, here’s one: http://ca.investing.com/tools/forex-pip-calculator
A wide variety of forex trading indicators are available at ProRealTime.com, including a forex support and resistance indicator for forex pivot points.
Technical Analysis Definition
Traders use technical analysis as a trading tool to evaluate tradables in an attempt to predict their current and future price direction and the extent to which they will travel in either direction.
They analyze stats gleaned from trading activity, such as price activity and volume.
Technical Analysis Explained in Simple Terms: Technical analysis entails focussing on price charts and various analytical tools in order to better understand a tradable’s strength or weakness, and determine future price movements.
Regarding technical analysis vs fundamental analysis, fundamental analysis focuses on such things as commitments of traders data, news, etc.
Inspiration
“If you want to change the world, start off by making your bed.”
Admiral William H. McRaven (U.S. Navy Retired) served with great distinction in the Navy.
In his thirty-seven years as a Navy SEAL, he commanded at every level.
As a Four-Star Admiral, his final assignment was as Commander of all U.S. Special Operations Forces.
He commanded the raid that led to the killing of Osama Bin Laden.
He is now Chancellor of the University of Texas System.
He is the author of ‘Make Your Bed: Little Things That Can Change Your Life… And Maybe the World’ (2017).
His graduation speech received over 10 million views on YouTube.
References
http://ca.investing.com/tools/forex-pip-calculator
http://www.gaincapital.com/ (Mark Galant)
http://www.investopedia.com/articles/technical/061801.asp
http://www.investopedia.com/terms/t/technicalanalysis.asp
https://en.wikipedia.org/wiki/Support_and_resistance
https://www.forex.com/en-ca/ (Brian Dolan)
https://www.prorealtime.com/en/
Conclusion
I hope you found this Best Technical Analysis: No. 1 Support and Resistance blog post to be instructive, and that you are now better equipped to develop an improved trading strategy.
These are important concepts to master, if you are to sharpen your trading skills.
If you are still not sure you understand what I have presented here, or if you have any technical analysis questions, please feel free to contact me here.
If you would like to arrange private consulting lessons with me on better understanding support and resistance levels, you can make your request at the same link.
Or, if you would like to have a trading adviser in your corner, use the same link to set that up.
If you haven’t already, check out my previous blog posts:
Three Winning Stock Trading Strategies
And, check me out here.
If you would like to help me start a forum and be a moderator, I would love to hear from you. Just drop me a line using the Contact provision at the bottom of my site.
If you would like to be featured in my blog, I would love to share your success story – or even your trading experience. Please send me a message using my Contact form at the bottom of this page.
I won’t live long enough to know it all, and I won’t live long enough to make all the mistakes myself. So, hearing your story will be most helpful not only to me, but also for my other beloved readers.
Please share this post. Sharing is caring. Thank you!
I look forward to your articles, feedback, ideas, stories, and suggestions for my blog. Please post these on my blog at the Contact link below.
HAVE FUN and ENJOY LIFE! Remember – FAMILY comes first!
Here’s To Your Success and Quality of Life,

Peter R. Bain
PS: Don’t let them steal your dreams!
PPS: I will help you achieve your dreams!
About Peter R. Bain

Peter R. Bain
I am a speaker, trader, writer, aviator, car nut, Harley enthusiast but, above all else, I am here for you at TradingSmarts, which I founded some 15 years ago.
TradingSmarts is your best friend when it comes to finding anything and everything to do with trading. Through my blog you will always find guides, news, reviews, tutorials, and much, much more.
TradingSmarts is a ‘NO-BS, No-Holds-Barred, Take-No- Prisoners’ site for traders who want the straight-bill-of-goods on how to make a full-time income trading less than part-time.
Noel Aranas of New Jersey: “It is my pleasure being a client of yours.”
Take your trading to the next level…
Click here to Get Started
Submit a Comment
After you share this post, please let me know what you think of this post in the comments section below. Don’t know where to start? Let me know what I can do for you. How can I help you? Thank you in advance!

I’ll be around to give personal advice and guidance, and answer your questions. So, please feel free to leave a comment with your feedback below right now. I am here for you. That’s what TradingSmarts is all about.


Please keep in mind that all comments are moderated according to my Privacy Policy, and all links are nofollow. Please do NOT use keywords in the name field. Let's keep our conversation meaningful personal.
I would appreciate it if you would provide the information marked *.
Your e-mail address will never be published. Thank you for sharing it. I will NEVER spam you - 100% privacy assured.
If you'd like a picture to show up by your name, get a Gravatar